
How Claude Code Solved Our 80,000 Marker Performance Crisis
The Challenge: Rendering 80,000+ Markers on Google Maps Without Freezing the Browser
Get the Complete Implementation Guide
Ready for AI Agents: This 589-line markdown file is specifically formatted for AI coding assistants. Simply feed it to Claude Code, Cursor, GitHub Copilot, or any AI agent and ask it to implement the Supercluster pattern in your project. The guide contains complete, copy-paste code examples, step-by-step instructions, and configuration options that AI agents can follow precisely to upgrade your Google Maps implementation. DOWNLOAD IMPLEMENTATION GUIDE (.md)If you've ever tried to display tens of thousands of markers on Google Maps, you know the pain: the browser freezes, memory usage explodes to gigabytes, and your users are left staring at an unresponsive page. This is one of the most common performance problems developers face when building location-based applications, real estate platforms, logistics dashboards, or any system that needs to visualize large geographic datasets.
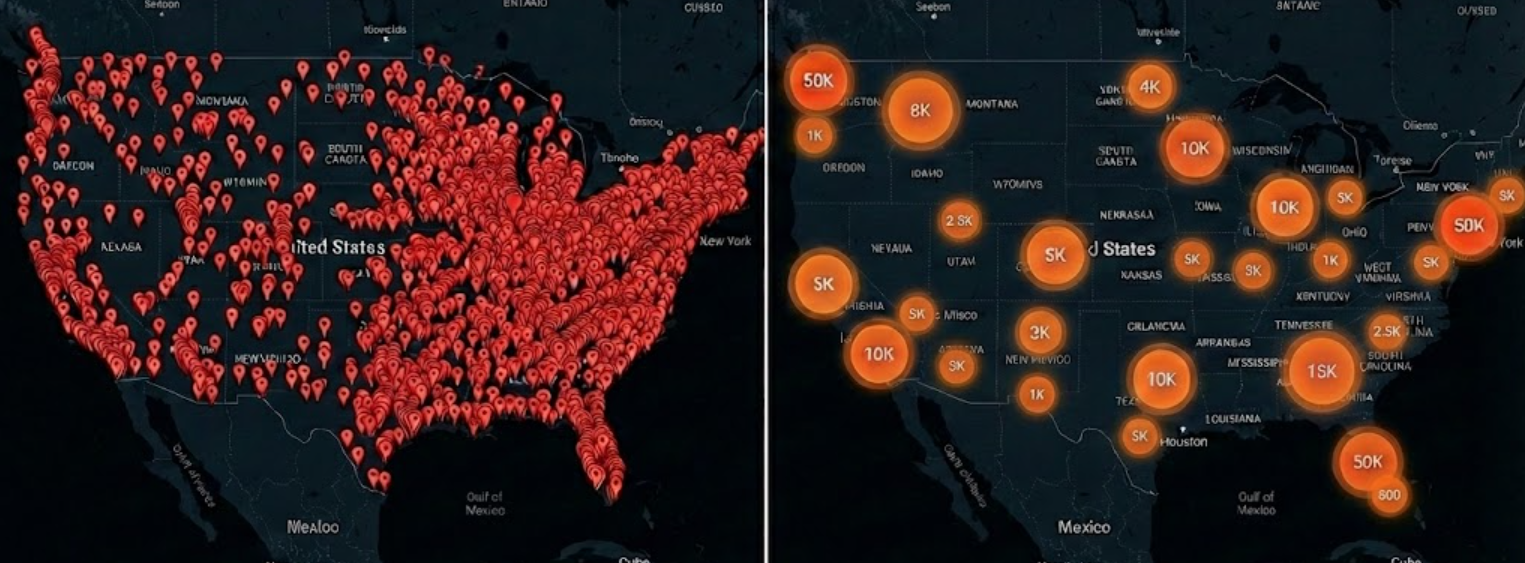
This is exactly what happened when our application needed to render 80,000 address markers on a Google Maps JavaScript API implementation. The traditional approach—creating a google.maps.Marker object for each data point—caused catastrophic performance issues that made the application unusable.
Claude Code analyzed the problem and identified a fundamental architectural issue with the traditional approach. The solution? The Supercluster viewport rendering pattern—a technique that reduced our Google Maps performance from a 10-second freeze with 2GB memory usage to instant loading with only 25MB of RAM.This comprehensive guide covers everything you need to know: the technical reasons why traditional marker rendering fails, the complete implementation of the Supercluster pattern, common pitfalls and how to avoid them, and a step-by-step migration path from MarkerClusterer to Supercluster for large-scale map marker rendering.
Understanding the Problem: Why Google Maps Slows Down with Many Markers
Before diving into the solution, it's essential to understand exactly why rendering large numbers of markers causes such severe performance problems. This knowledge will help you appreciate why the Supercluster pattern works and when to apply it.
How Google Maps Markers Work Internally
When you create a google.maps.Marker object, the Google Maps JavaScript API does much more than just draw a pin on the map. Each marker involves:
DOM Element Creation: Every marker creates actual HTML elements in the page's Document Object Model. These elements need to be styled, positioned, and managed by the browser's rendering engine. Event Listener Attachment: Each marker can respond to clicks, hovers, and other interactions. The Maps API attaches event listeners for each marker, which the browser must track and process. Rendering Layer Management: Markers exist in overlay layers that the Maps API manages. Each marker requires calculations for positioning, z-index ordering, and visibility determination. Memory Allocation: Each Marker object consumes approximately 20-25 kilobytes of memory when you account for the JavaScript object itself, its associated DOM elements, event handlers, and internal Maps API tracking structures.The Mathematics of Memory Explosion
Let's do the math for a dataset of 80,000 address markers:
Memory per marker: about 25 KB (conservative estimate) Total markers: 80,000 Total memory: 80,000 × 25 KB = 2,000,000 KB = 2 GBThat's 2 gigabytes of RAM consumed just for the markers—before accounting for the map tiles, your application code, or anything else the browser needs to run. Most users' browsers will struggle or crash entirely with this memory load.
The Synchronous Execution Problem
JavaScript is single-threaded, meaning only one piece of code can execute at a time. When you loop through 80,000 items creating Marker objects, that loop must complete before the browser can do anything else—including:
- Responding to user clicks or scrolls
- Updating the UI
- Rendering the page
- Running any other JavaScript
Why Traditional Google Maps Marker Rendering Fails at Scale
The Naive Approach That Crashes Browsers
The standard approach to showing markers on Google Maps looks something like this:
The problematic pattern:- Fetch address data from an API
- Loop through all addresses
- Create a new google.maps.Marker for each one
- Push each marker to an array
- Optionally add array to MarkerClusterer for visual clustering
| Issue | Technical Impact | User Experience Impact |
|---|---|---|
| DOM Object Overhead | Each google.maps.Marker creates HTML elements, event listeners, and rendering layers (about 20-25KB per marker) | Browser memory consumption explodes |
| Synchronous Execution | The forEach loop blocks the main thread entirely for 5-15 seconds | UI completely freezes, appears crashed |
| Memory Explosion | 80,000 × 25KB = 2GB of RAM consumed before anything displays | Browser may crash, tab killed by OS |
| UI Thread Blocking | Browser is unresponsive during entire marker creation process | Users abandon the application |
| Garbage Collection Pressure | Massive memory allocation triggers aggressive GC | Additional stuttering and freezes |
Why Google Maps MarkerClusterer Doesn't Solve the Problem
When developers encounter performance issues with many markers, MarkerClusterer is often the first solution they try. MarkerClusterer is a Google Maps library that groups nearby markers into clusters, showing a single cluster marker with a count instead of many individual markers.
The misconception: Many developers believe MarkerClusterer solves the performance problem because it reduces visual clutter. The reality: MarkerClusterer still creates all 80,000 Marker objects upfront. Clustering just hides them visually—it doesn't solve the underlying memory and creation performance problem.Here's what happens with MarkerClusterer:
1. You create all 80,000 google.maps.Marker objects (2GB memory, 5-15 second freeze)
2. You pass all 80,000 markers to MarkerClusterer
3. MarkerClusterer calculates which markers should be grouped
4. MarkerClusterer hides most markers and shows cluster markers instead
The initial performance hit still happens. You've just hidden the visual result of your 80,000 markers, but all 80,000 Marker objects still exist in memory, still consume 2GB of RAM, and still caused a 5-15 second freeze during creation.
MarkerClusterer is useful for improving visual clarity when you have overlapping markers, but it is not a performance optimization for large datasets.
Claude Code's Solution: The Supercluster Viewport Rendering Pattern
The Key Insight: Users Never See All Markers at Once
Claude Code identified the fundamental insight that makes this optimization possible: Users never see 80,000 markers at once.Think about how users interact with a map:
When zoomed out (viewing a large geographic area like a country or state): Users see the big picture. At this zoom level, 80,000 individual markers would be so densely packed they'd appear as a solid blob. Instead, users benefit from seeing aggregate clusters—"there are 5,000 points in this region" is more useful than trying to show 5,000 overlapping pins. When zoomed in (viewing a neighborhood or street): Users can now see individual markers, but the viewport only contains a small geographic area. Even if your dataset has 80,000 points across a country, a zoomed-in view of a single city block might only contain 50-200 points. This insight leads to a powerful optimization: Only create Marker objects for what's currently visible in the viewport.The Principle of Viewport-Based Rendering
Instead of creating all markers upfront and hiding most of them, we:
1. Store all coordinates as lightweight data (just numbers, not DOM objects) 2. Build a spatial index that can quickly answer "which points are in this viewport?" 3. On each viewport change (user pans or zooms), query the index and render only visible points 4. Re-render when the viewport changes with new visible pointsThis means at any given moment, we only have 100-200 Marker objects in memory, regardless of whether the total dataset contains 80,000 or 800,000 points.
The Three-Layer Data Architecture
The Supercluster pattern separates concerns into three distinct layers, each optimized for its specific purpose:
Layer 1: Raw Data Layer
Purpose: Store the source of truth for all your geographic data Implementation: A simple JavaScript array of objects containing coordinates and properties Memory usage: about 100 bytes per point (just the data, no DOM overhead) For 80,000 points, this layer uses approximately 8MB of memory—a fraction of the 2GB that 80,000 Marker objects would consume. Key characteristics:- Never modified after initial load
- Contains all the information needed to create markers on demand
- Can include additional properties (name, ID, category, etc.) for info windows
- Lightweight enough to hold millions of points if needed
Layer 2: Spatial Index Layer
Purpose: Enable fast queries for "which points are visible in this viewport?" Implementation: Supercluster library using R-tree spatial indexing Memory usage: about 15MB for the index structure (80,000 points)The spatial index is the key to making viewport queries fast. Without an index, finding visible points would require checking all 80,000 points on every pan/zoom—O(n) complexity. With an R-tree index, the query is O(log n), meaning it's nearly instantaneous regardless of dataset size.
Key characteristics:- Built once during initial data load (about 50ms for 80,000 points)
- Provides O(log n) viewport queries via getClusters(bbox, zoom)
- Automatically handles clustering at different zoom levels
- Returns cluster metadata (point count, expansion zoom level)
Layer 3: Visible Markers Layer
Purpose: The actual DOM elements users see and interact with Implementation: google.maps.Marker objects, but only 100-200 at a time Memory usage: about 2-5MB (only for visible markers)This layer contains the only actual Marker objects. Because we limit this to what's visible in the current viewport, we never have more than a few hundred markers regardless of total dataset size.
Key characteristics:- Re-created on every viewport change (pan/zoom)
- Previous markers are destroyed before new ones are created
- about 10ms to re-render 100-200 markers (imperceptible to users)
- Includes both cluster markers and individual point markers
Total Architecture Memory Usage
| Layer | Memory (80K points) | Purpose |
|-------|--------------------|---------|
| Raw Data | about 8MB | Source of truth |
| Spatial Index | about 15MB | Fast viewport queries |
| Visible Markers | about 2-5MB | User-visible DOM elements |
| Total | about 25MB | Complete solution | Compare this to the traditional approach: about 2GB for the same 80,000 points. That's a 100x memory reduction.Performance Comparison: Before and After Supercluster Implementation
The real-world results from implementing this pattern on our 80,000-marker dataset:
| Metric | Before (MarkerClusterer) | After (Supercluster) | Improvement |
|---|---|---|---|
| Memory usage | about 2GB | about 25MB | 100x reduction |
| Initial load freeze | 5-10 seconds | 0 seconds | Complete elimination |
| Time to interactive | 10-15 seconds | <1 second | 15x faster |
| Pan/zoom responsiveness | Laggy, stuttering | Instant, smooth | Night and day difference |
| Markers created | 80,000 DOM objects | 100-200 DOM objects | 400x fewer |
| Scales to | about 50K before crash | 500K+ smoothly | 10x+ capacity |
| Server round-trips on pan/zoom | N/A | None (client-side) | Offline capable |
| Memory growth over time | Increases with leaked handlers | Stable | No memory leaks |
Implementation Guide: Step-by-Step Supercluster Setup
This section provides a complete walkthrough of implementing the Supercluster viewport rendering pattern. Each step builds on the previous one to create a fully functional, high-performance map marker system.
Step 1: Add the Supercluster Library
Supercluster is a JavaScript library developed by Mapbox for fast geospatial point clustering. Despite being created by Mapbox, it works perfectly with Google Maps or any other mapping library.
Using CDN (simplest for quick integration):Add the following script tag to your HTML head or before your application script:
Script source: https://unpkg.com/supercluster@8.0.1/dist/supercluster.min.js
Using npm (recommended for modern JavaScript applications):Run: npm install supercluster
Then import in your JavaScript module: import Supercluster from 'supercluster';
The library is small (about 15KB gzipped) and has no dependencies, making it a lightweight addition to your project.
Step 2: Define Your Data Variables
The first code change is replacing your old single marker array with three separate variables, each serving a distinct purpose:
clusterIndex: The Supercluster spatial index instance. This will be null until you build it during data loading. rawData: An array containing your raw coordinate data as lightweight JavaScript objects. These are NOT Marker objects—just plain data with latitude, longitude, and any properties you need. visibleMarkers: An array containing the currently displayed google.maps.Marker objects. This array is small (100-200 items) and is completely rebuilt on each viewport change.This separation of concerns is the key architectural insight: data storage is separate from visual rendering.
Step 3: Build the Spatial Index with GeoJSON Conversion
Supercluster requires data in GeoJSON format. This means converting your address objects to GeoJSON Feature objects before loading them into the index.
The buildClusterIndex function performs two tasks:
Task 1: Convert to GeoJSON FeaturesEach address object becomes a GeoJSON Feature with:
- type: 'Feature' (required by GeoJSON spec)
- properties: An object containing any data you want accessible later (ID, name, etc.)
- geometry: A Point geometry with coordinates in [longitude, latitude] order
Create a new Supercluster instance with your configuration options:
- radius (default: 40): Cluster radius in pixels. Higher values create fewer, larger clusters. 60 works well for dense datasets.
- maxZoom (default: 16): The zoom level at which clustering stops. At zoom levels above this, individual points are shown. 16 is typically street-level.
- minZoom (default: 0): The minimum zoom level for clustering. 0 starts at world view.
- minPoints (default: 2): Minimum number of points to form a cluster.
Step 4: Implement Viewport-Based Rendering
The renderVisibleClusters function is the heart of the pattern. It's called on every map 'idle' event, which fires after the user finishes panning or zooming.
Step 4a: Guard clauseAlways check if the clusterIndex exists before proceeding. The idle event might fire before your data has loaded.
Step 4b: Clear existing markersBefore creating new markers, remove all existing visible markers by calling setMap(null) on each one, then empty the visibleMarkers array. Failing to do this causes markers to accumulate, eventually creating thousands of overlapping markers.
Step 4c: Get current viewport boundsCall map.getBounds() to get a LatLngBounds object representing the visible map area. Also get the current zoom level with map.getZoom().
Step 4d: Convert bounds to bbox formatSupercluster uses a bounding box array format: [west, south, east, north], which corresponds to [minLongitude, minLatitude, maxLongitude, maxLatitude].
Extract these values from the Google Maps bounds object:
- west = bounds.getSouthWest().lng()
- south = bounds.getSouthWest().lat()
- east = bounds.getNorthEast().lng()
- north = bounds.getNorthEast().lat()
Call clusterIndex.getClusters(bbox, zoom) to get an array of visible clusters and individual points. This query is O(log n) and returns in milliseconds regardless of dataset size.
Step 4f: Create markers for each resultLoop through the results. Each result is either a cluster or an individual point:
- Clusters have cluster: true in their properties, plus point_count (number of contained points) and cluster_id (used for expansion zoom calculation)
- Individual points have your original properties from the GeoJSON conversion
Step 5: Create Custom Cluster Markers with Click-to-Zoom
Cluster markers require special handling because they represent multiple points and should zoom in when clicked.
Visual appearance:Create a custom SVG icon for clusters. A common design uses concentric circles with decreasing opacity to create a "halo" effect. The inner circle is fully opaque, surrounded by semi-transparent outer rings.
The marker label shows the point count. For large counts, format as "5k" instead of "5000" to keep the label readable.
Set a high zIndex based on point count so larger clusters appear on top of smaller ones.
Click-to-zoom behavior:When a cluster is clicked, calculate the appropriate zoom level using clusterIndex.getClusterExpansionZoom(clusterId). This returns the minimum zoom level that will cause this cluster to expand into smaller clusters or individual points.
Cap the expansion zoom at a reasonable maximum (like 18) to prevent zooming beyond useful street-level views.
Then call map.setZoom() and map.panTo() to animate to that location at the new zoom level.
Step 6: Create Individual Point Markers
Individual point markers are simpler than clusters. They represent a single location from your dataset.
Visual appearance:Use a simple circle icon (google.maps.SymbolPath.CIRCLE) with consistent styling. A 6-pixel radius with a colored fill and white stroke works well.
Set a lower zIndex than clusters so individual points appear beneath cluster markers when they overlap at zoom transitions.
Info windows:Attach an info window to each point marker showing details from the properties object. This is where properties you passed during GeoJSON conversion become useful—ID, name, address, category, or any other data you want to display.
Step 7: Wire Up the Data Loading Flow
The data loading function orchestrates the entire initialization:
1. Fetch data from your API: Get the address/location data from your backend 2. Store in rawData: Save the lightweight data array for reference 3. Build the spatial index: Call buildClusterIndex with the raw data 4. Attach idle listener: Set up the viewport change handler 5. Initial render: Call renderVisibleClusters for the initial viewUse google.maps.event.addListenerOnce for the initial map idle event to ensure the map is fully initialized before loading data.
Step 8: Implement Cleanup for Component Unmounting
If your map is part of a single-page application where users navigate between views, you must clean up resources when the map component unmounts:
1. Remove all visible markers: Call setMap(null) on each marker 2. Clear the marker array: Empty the visibleMarkers array 3. Clear the index: Set clusterIndex to null 4. Clear the raw data: Empty the rawData array (if not needed elsewhere) 5. Remove event listeners: Call google.maps.event.clearListeners(map, 'idle')Failing to remove the idle listener causes it to continue firing even after the map is gone, potentially causing errors or memory leaks.
Common Pitfalls and How to Avoid Them
Based on real-world implementations, here are the most common mistakes developers make when implementing the Supercluster pattern, along with how to avoid them:
Pitfall 1: Wrong Coordinate Order in GeoJSON
The problem: GeoJSON uses [longitude, latitude] order, which is the opposite of Google Maps' {lat, lng} format and human intuition (we usually say "lat, long"). Symptoms: All markers appear in the wrong location—often in the ocean, on the opposite side of the world, or clustered at (0, 0). The fix: When converting to GeoJSON, always use coordinates: [longitude, latitude], not coordinates: [latitude, longitude]. Memory device: Longitude is the "long" one (larger range, -180 to 180), and it comes first in GeoJSON. Or remember "GeoJSON is backwards from what you expect."Pitfall 2: Forgetting to Clear Old Markers
The problem: Each time renderVisibleClusters runs, new markers are created. If you don't remove the old markers first, they accumulate. Symptoms: Performance degrades over time as you pan/zoom. After a few viewport changes, you have thousands of markers instead of 100-200. The map becomes sluggish, then freezes entirely. The fix: Always clear existing markers at the start of renderVisibleClusters. Loop through visibleMarkers calling setMap(null) on each, then set visibleMarkers to an empty array.Pitfall 3: Not Removing the Idle Listener on Cleanup
The problem: If you navigate away from the map component without removing the idle listener, it continues firing and tries to call renderVisibleClusters on a destroyed component. Symptoms: Console errors about null references. Memory leaks. Strange behavior if you return to the map view. The fix: In your cleanup/unmount function, call google.maps.event.clearListeners(map, 'idle') before destroying the map reference.Pitfall 4: Calling getClusters Before Index is Ready
The problem: The map's idle event might fire before your async data fetch completes and the index is built. Symptoms: Errors like "Cannot read property 'getClusters' of null" or "clusterIndex is null." The fix: Add a guard clause at the very start of renderVisibleClusters: if (!clusterIndex) return;Pitfall 5: Using Wrong Bounding Box Format
The problem: Supercluster expects bbox as [west, south, east, north] (i.e., [minLng, minLat, maxLng, maxLat]). Other formats cause incorrect or empty query results. Symptoms: No markers appear, or only markers in one corner of the viewport appear. The fix: Carefully extract bounds in the correct order:- bbox[0] = west = getSouthWest().lng()
- bbox[1] = south = getSouthWest().lat()
- bbox[2] = east = getNorthEast().lng()
- bbox[3] = north = getNorthEast().lat()
Pitfall 6: Not Handling Empty Bounds
The problem: If getBounds() is called before the map is fully initialized, it returns null or undefined. Symptoms: Errors when trying to call methods on undefined bounds. Markers don't appear on initial load. The fix: Add a guard clause: if (!bounds) return; immediately after calling getBounds().Pitfall 7: Forgetting Properties During GeoJSON Conversion
The problem: When converting to GeoJSON, you only include coordinates but forget to include the properties you need later (ID, name, address, etc.). Symptoms: Info windows are empty or show "undefined." You can't identify which point was clicked. The fix: When creating GeoJSON features, explicitly copy all needed properties into the properties object. These are preserved through clustering and available when creating markers.When to Use This Pattern (And When Not To)
The Supercluster viewport rendering pattern is powerful but not universally applicable. Here's when to use it and when simpler approaches work better:
Use Supercluster Viewport Rendering When:
Large datasets (1,000+ points): The pattern shines when you have thousands of points. The overhead of maintaining a spatial index is negligible compared to the memory savings. Users report slow loading or browser freezing: If your current implementation causes noticeable delays or unresponsiveness, viewport rendering will likely solve it. Memory usage is problematically high: If browser memory consumption is causing crashes or degraded performance, reducing from 2GB to 25MB makes a dramatic difference. You need smooth pan/zoom performance at any scale: Viewport rendering maintains consistent about 10ms re-render times regardless of dataset size. Dataset could grow significantly: If your application might scale from 10K to 100K to 500K points, viewport rendering handles all sizes equally well. Mobile devices are a target platform: Mobile browsers have stricter memory limits. Viewport rendering keeps memory low enough for mobile.Don't Use This Pattern When:
Small datasets (under 1,000 points): Traditional marker creation works fine. The added complexity of viewport rendering isn't justified. Static, non-interactive maps: If users can't pan or zoom, there's no viewport change to trigger re-rendering. Pre-render once and you're done. Markers require complex persistent state: If markers have drag-and-drop behavior, ongoing animations, or state that must persist across re-renders, viewport rendering's destroy-and-recreate approach complicates things. You need marker object references to persist: If other parts of your code hold references to specific Marker objects, those references become invalid when markers are recreated on viewport change. Real-time updates to individual markers: If you're frequently updating individual markers (position, icon, etc.), constantly recreating all visible markers may be inefficient. Consider a hybrid approach.Configuration Tuning for Different Dataset Sizes
The Supercluster constructor accepts several configuration options that affect clustering behavior. Here are recommended settings for different dataset sizes:
| Dataset Size | radius | maxZoom | minPoints | Notes |
|---|---|---|---|---|
| 1K - 10K | 40 | 14 | 2 | Smaller radius for better point differentiation, earlier unclustering |
| 10K - 50K | 50 | 15 | 2 | Balanced settings for medium datasets |
| 50K - 200K | 60 | 16 | 3 | Larger radius keeps cluster counts manageable |
| 200K - 1M | 80 | 17 | 5 | Aggressive clustering for massive datasets |
| 1M+ | 100 | 18 | 10 | Maximum clustering, may want server-side pre-processing |
Migration Checklist: MarkerClusterer to Supercluster
If you're migrating an existing Google Maps implementation that uses MarkerClusterer to the Supercluster viewport rendering pattern, use this checklist to ensure you don't miss any steps:
Phase 1: Add New Infrastructure- Add Supercluster library via npm or CDN
- Create three new variables: clusterIndex, rawData, visibleMarkers
- Implement buildClusterIndex function with GeoJSON conversion
- Implement renderVisibleClusters function with bbox query
- Implement createClusterMarker function with SVG icon and click-to-zoom
- Implement createPointMarker function for individual points
- Implement cleanup function with proper listener removal
- Update data loading to store raw data instead of creating Marker objects immediately
- Call buildClusterIndex after data is fetched
- Add map.addListener('idle', renderVisibleClusters)
- Call renderVisibleClusters for initial render after index is built
- Test at minimum zoom (world view) - should show large clusters
- Test at maximum zoom (street level) - should show individual points
- Test rapid panning - should remain responsive
- Test with browser dev tools Memory tab - should stay around 25MB
- Test with browser dev tools Performance tab - no long tasks during pan/zoom
- Remove old MarkerClusterer library import
- Remove old marker array variables
- Remove old clusterer initialization code
- Remove any code that accessed old marker array
Advantages and Disadvantages Summary
Advantages
| Benefit | Detailed Explanation |
|---|---|
| 100x memory reduction | 2GB down to 25MB for 80,000 points. Enables datasets that would crash browsers. |
| No UI freezing | Main thread is never blocked during marker operations. All marker creation is incremental and fast. |
| Instant interactivity | Page is responsive immediately after initial data fetch. No waiting for marker creation. |
| Smooth pan/zoom | Only 100-200 markers re-rendered per viewport change. Takes about 10ms, imperceptible to users. |
| Scales to millions | Same performance characteristics whether you have 50K or 500K points. Index queries are O(log n). |
| Click-to-zoom UX | Built-in cluster expansion that users already understand from other mapping applications. |
| Client-side indexing | No server round-trips on pan/zoom. Works offline after initial data load. |
| Predictable memory usage | Memory stays constant regardless of panning/zooming. No accumulation or leaks. |
| Works with any mapping library | Supercluster is mapping-library-agnostic. Works with Google Maps, Leaflet, Mapbox, etc. |
Disadvantages
| Tradeoff | Mitigation Strategy |
|---|---|
| Extra library dependency | Supercluster is small (about 15KB gzipped), well-maintained, and has no dependencies |
| GeoJSON conversion required | One-time cost during initial load, adds about 50ms for 80K points |
| Markers recreated on pan/zoom | Only 100-200 markers, takes about 10ms, happens after user stops interacting |
| No marker object persistence | Store state in rawData properties, retrieve via marker's associated data |
| Learning curve | This comprehensive guide provides copy-paste implementation |
| Cluster click requires special handling | Use getClusterExpansionZoom() API as shown in this guide |
| Properties must be copied to GeoJSON | Include all needed properties during conversion step |
Real-World Performance: APS Territory Map Case Study
The Supercluster pattern was implemented in the APS Territory Map application, which needed to display 80,000 address markers across a multi-state service territory.
Before Implementation (MarkerClusterer Approach)
The original implementation created all 80,000 Marker objects upfront:
User experience:- Page appeared frozen for 8-12 seconds after data loaded
- Browser memory climbed to 2+ GB
- Some users experienced browser crashes
- Pan and zoom were sluggish even after initial load
- Mobile users couldn't use the feature at all
- Time to create markers: 8-12 seconds (main thread blocked)
- Memory usage: 2.1 GB peak
- Time to first interaction: 15+ seconds
- Markers in memory: 80,000
After Implementation (Supercluster Pattern)
Claude Code implemented the Supercluster viewport rendering pattern:
User experience:- Page is interactive within 1 second of data loading
- Smooth pan and zoom at any scale
- No crashes or slowdowns
- Works on mobile devices
- Clusters expand with satisfying zoom animation
- Time to create markers: <100ms (initial render of ~200 visible markers)
- Memory usage: 24 MB stable
- Time to first interaction: <1 second
- Markers in memory: about 150 (average visible at any time)
Advanced Topics and Optimizations
Custom Clustering Aggregations
Supercluster supports custom reduce functions to aggregate data during clustering. For example, you can sum values, calculate averages, or track min/max within clusters:
Use the reduce option in the Supercluster constructor. The reduce function receives (accumulated, props) and should modify accumulated in place.
The map option transforms properties before they enter the index, useful for extracting or computing values from your raw data.
Handling Cluster Expansion with Animation
For a polished user experience, animate the zoom when a cluster is clicked rather than jumping instantly:
Use map.setZoom() followed by map.panTo() for a smooth transition. Add a slight delay between setting zoom and panning for the best visual effect.
Hybrid Approaches for Complex Requirements
If you need some marker persistence (e.g., a few draggable markers) alongside viewport rendering:
1. Keep persistent markers in a separate array from visibleMarkers
2. Exclude persistent marker coordinates from the Supercluster index
3. Don't destroy persistent markers during renderVisibleClusters
4. Render persistent markers once, viewport markers dynamically
Download the Complete Implementation
The full 589-line implementation guide includes everything you need for a production-ready implementation:
- Complete JavaScript code examples ready to copy and paste
- Custom SVG cluster marker styling with count display
- Click-to-zoom cluster expansion with smooth animation
- Info window implementation for individual points
- Comprehensive cleanup and teardown functions
- Additional configuration options and tuning guidance
- Full GeoJSON conversion function with property handling
- Error handling and edge case management
Conclusion
Rendering large numbers of markers on Google Maps is a common challenge that causes serious performance problems when approached naively. The traditional method of creating a Marker object for each data point simply doesn't scale—80,000 markers means 2GB of memory and a frozen browser.
The Supercluster viewport rendering pattern solves this elegantly by recognizing that users never see all markers at once. By separating data storage from visual rendering and only creating Marker objects for the current viewport, we achieve:- 100x memory reduction (2GB → 25MB)
- Complete elimination of UI freezing
- Instant interactivity (<1 second to interactive)
- Smooth pan/zoom at any scale
- Scalability to 500K+ points with the same performance
Whether you're building a real estate platform, logistics dashboard, field service application, or any system that visualizes large geographic datasets, the Supercluster viewport rendering pattern will transform your map's performance from unusable to instant.
This comprehensive guide was developed by Claude Code based on real-world implementation experience solving the 80,000-marker performance crisis in the APS Territory Map application. The Supercluster viewport rendering pattern reduced memory usage by 100x and completely eliminated UI freezing.