
PlantUML Rendering Implementation Guide: From Plain Text to Beautiful Diagrams

PlantUML Rendering Implementation Guide
Download Complete Guide (Markdown) A comprehensive 749-line implementation guide covering everything from basic setup to advanced database schema generationOverview
This guide documents how to implement PlantUML diagram rendering in web applications. PlantUML is a powerful tool for generating UML diagrams from plain text descriptions. This implementation was successfully used in the Database Structure visualization feature shown below.
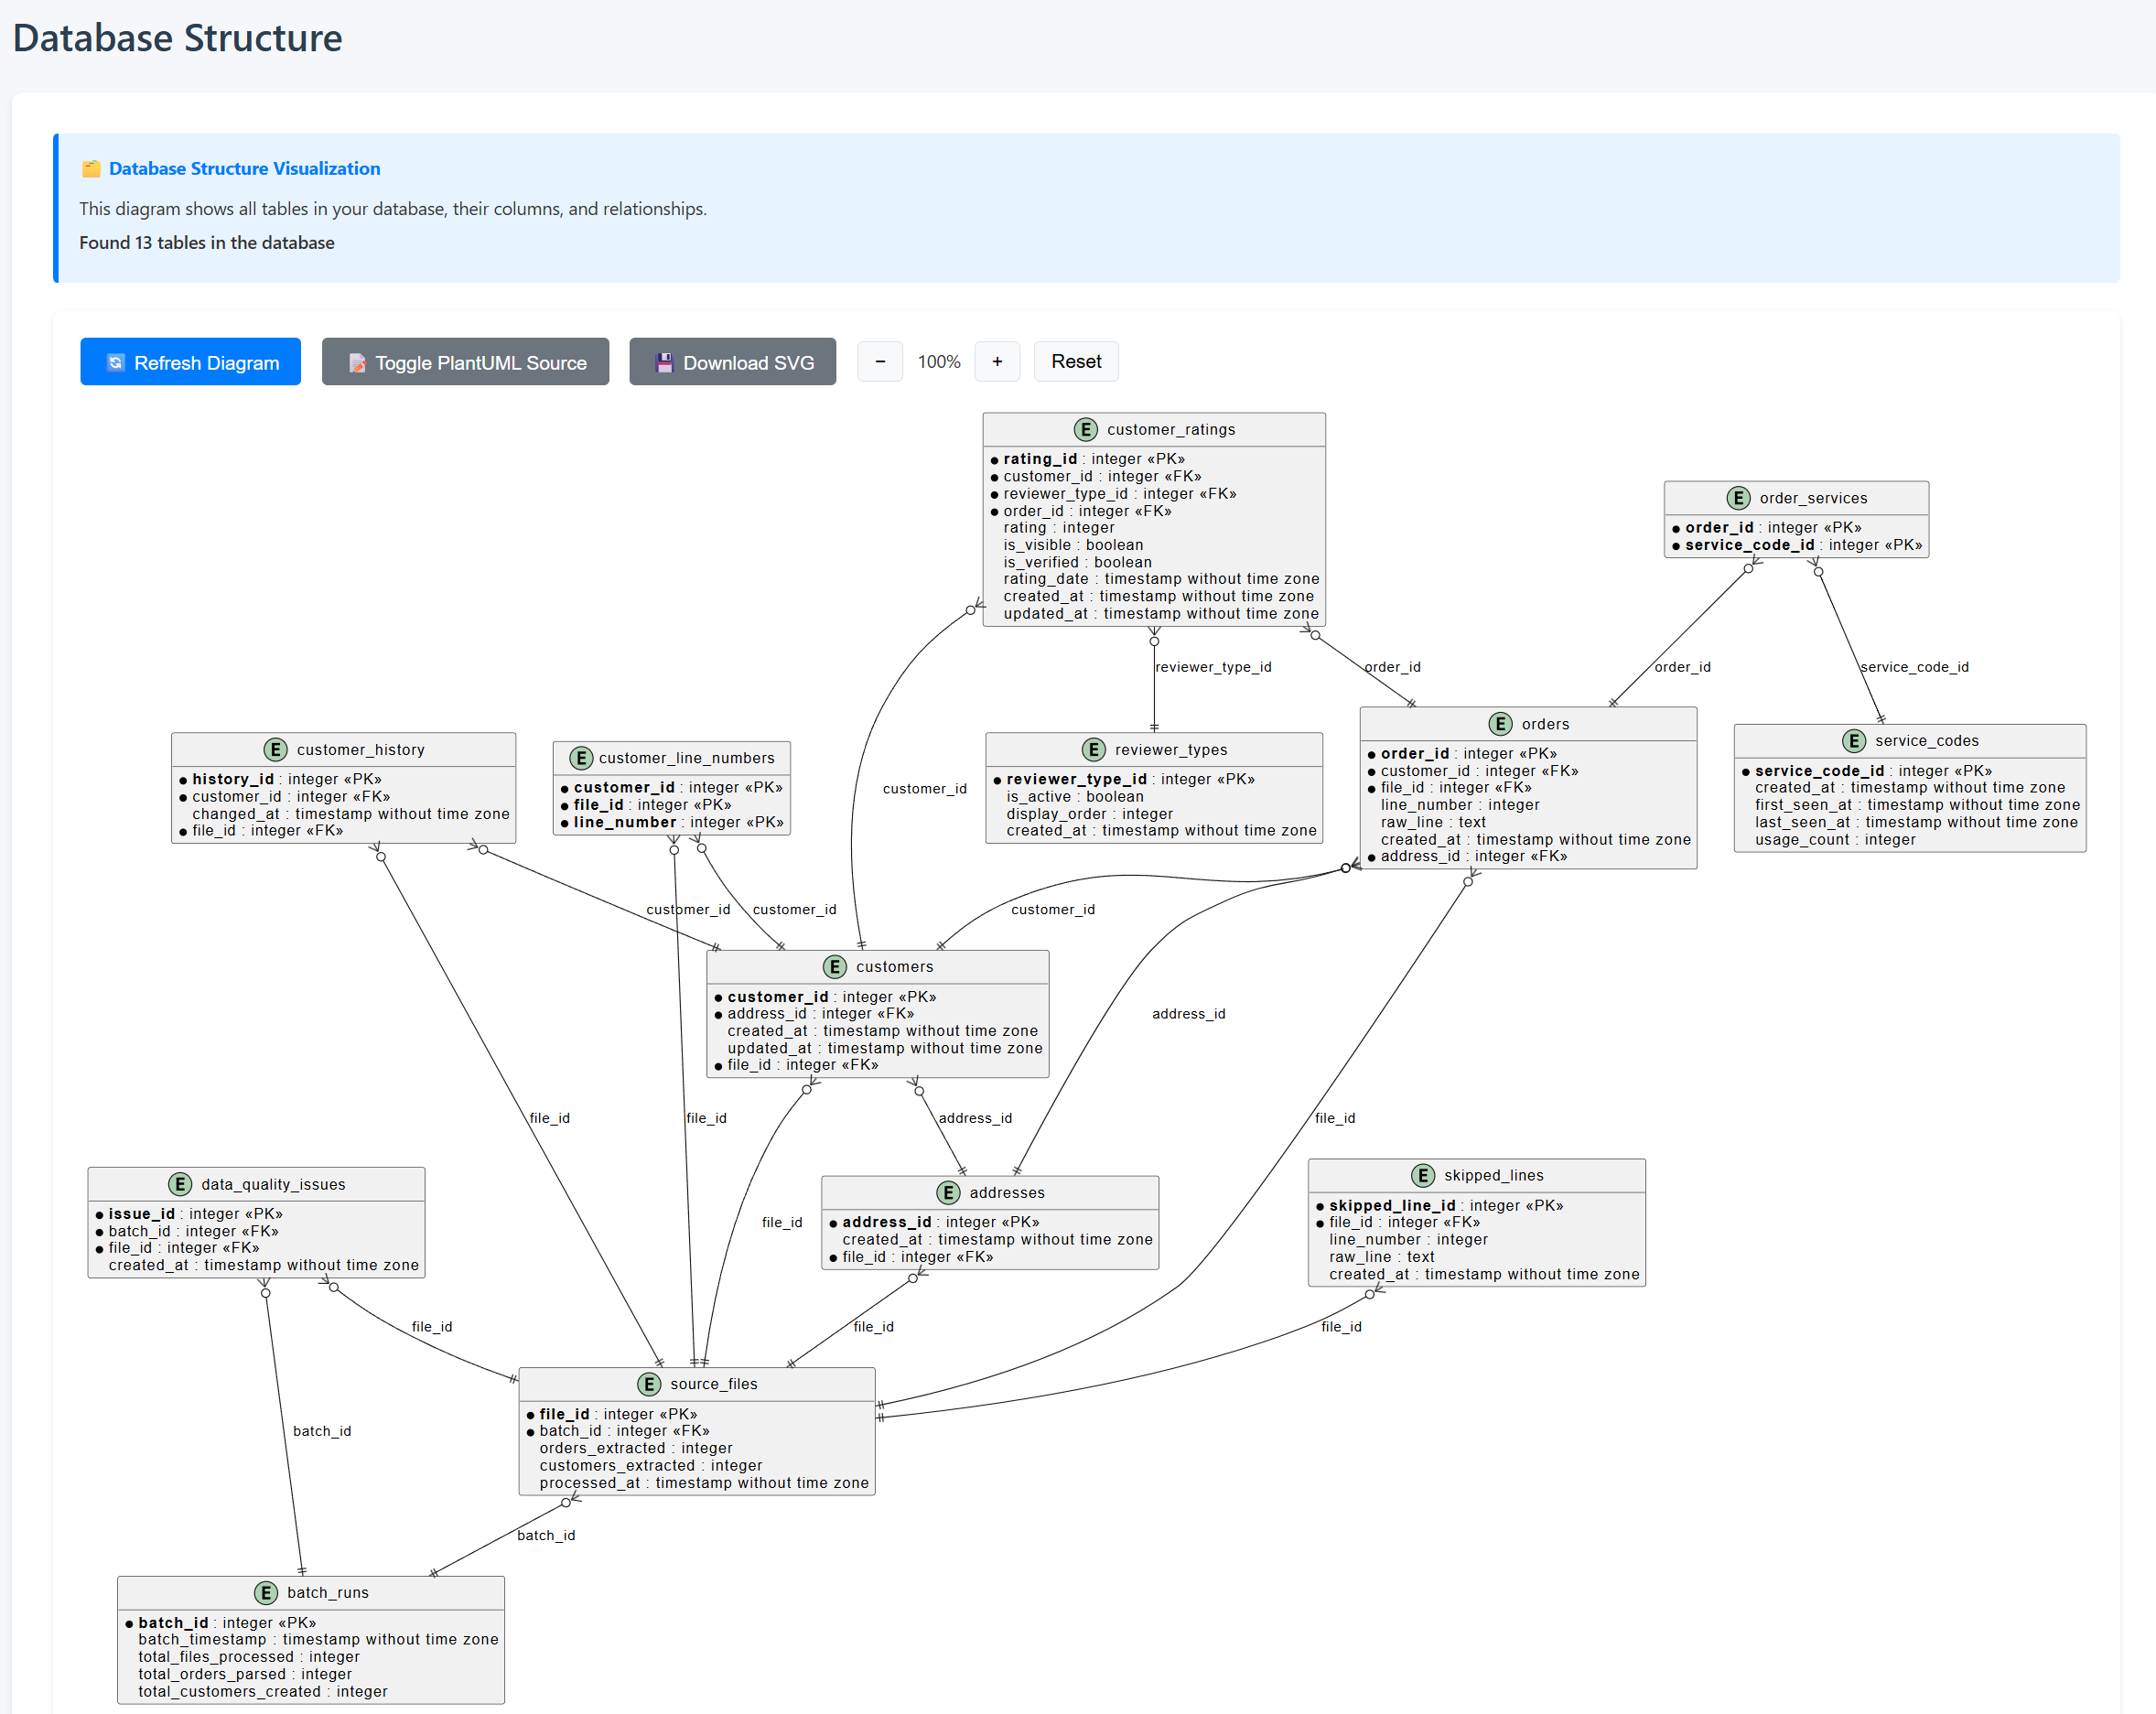 Real-world example: Database structure with 13 tables visualized using PlantUML ERD syntax
What is PlantUML?
PlantUML is a component that allows you to create diagrams from plain text using a simple and intuitive language. It supports:- Entity-Relationship Diagrams (ERD) - Perfect for database visualization
- Class diagrams - Object-oriented design documentation
- Sequence diagrams - System interaction flows
- Use case diagrams - Requirement analysis
- Activity diagrams - Process workflows
- Component diagrams - System architecture
- State diagrams - State machine visualization
- And many more...
Architecture Overview
There are three main approaches to rendering PlantUML diagrams:
1. Public PlantUML Server (Recommended for Prototypes)
- Pros: No server setup, works immediately, always up-to-date
- Cons: Requires internet connection, potential privacy concerns, rate limiting
- URL: \
https://www.plantuml.com/plantuml/\
2. Self-Hosted PlantUML Server
- Pros: Full control, privacy, no rate limits
- Cons: Requires Java, GraphViz, and server maintenance
- Setup: Docker image available: \
plantuml/plantuml-server\
3. Local PlantUML CLI
- Pros: Complete offline functionality, no external dependencies
- Cons: Requires Java and GraphViz installation, more complex integration
- Setup: Download JAR from plantuml.com
Implementation: Client-Side Rendering (Used in This Project)
Required Components
#### 1. JavaScript Compression Library
PlantUML requires proper DEFLATE compression. Use pako.js: \\\`html
\\\`
Why pako?
- Provides proper DEFLATE compression (required by PlantUML)
- Small footprint (~45KB minified)
- No dependencies
- Works in all modern browsers
PlantUML uses a specific encoding scheme:
UTF-8 Text → DEFLATE Compression → Custom Base64 Encoding \\\`javascript
function encodePlantUML(plantuml) {
// Step 1: Convert string to UTF-8 bytes
const utf8 = unescape(encodeURIComponent(plantuml));
// Step 2: Compress using DEFLATE (pako library)
const compressed = pako.deflateRaw(utf8, { level: 9 });
// Step 3: Encode to PlantUML-specific base64
return encode64(compressed);
}
function encode64(data) {
// PlantUML uses custom base64 alphabet
let r = "";
const chars = "0123456789ABCDEFGHIJKLMNOPQRSTUVWXYZabcdefghijklmnopqrstuvwxyz-_";
for (let i = 0; i < data.length; i += 3) {
if (i + 2 == data.length) {
r += append3bytes(data[i], data[i + 1], 0);
} else if (i + 1 == data.length) {
r += append3bytes(data[i], 0, 0);
} else {
r += append3bytes(data[i], data[i + 1], data[i + 2]);
}
}
return r;
}
function append3bytes(b1, b2, b3) {
const chars = "0123456789ABCDEFGHIJKLMNOPQRSTUVWXYZabcdefghijklmnopqrstuvwxyz-_";
const c1 = b1 >> 2;
const c2 = ((b1 & 0x3) << 4) | (b2 >> 4);
const c3 = ((b2 & 0xF) << 2) | (b3 >> 6);
const c4 = b3 & 0x3F;
return chars.charAt(c1) + chars.charAt(c2) + chars.charAt(c3) + chars.charAt(c4);
}
\\\`
#### 3. Rendering the Diagram
\\\`javascript
async function renderDiagram(plantumlCode) {
// Encode the PlantUML code
const encoded = encodePlantUML(plantumlCode);
// Build the URL (svg, png, or txt format)
const plantUMLServer = 'https://www.plantuml.com/plantuml/svg/';
const imageUrl = plantUMLServer + encoded;
// Create and display image
const img = document.createElement('img');
img.src = imageUrl;
img.alt = 'PlantUML Diagram';
// Handle errors
img.onerror = () => {
console.error('Failed to load PlantUML diagram');
// Show error message to user
};
// Add to page
document.getElementById('diagram-container').appendChild(img);
}
\\\`
PlantUML Syntax Guide
Basic Structure
All PlantUML diagrams start with \@startuml\ and end with \@enduml\:
\\\`plantuml
@startuml
' Your diagram code here
@enduml
\\\`
Comments
- Single-line: \
' This is a comment\ - Multi-line: \
/' Multi-line comment '/\
Entity Relationship Diagrams (ERD)
Example Implementation: \\\`plantuml
@startuml
!define table(x) entity x
' Define entities
entity "customers" {
* customer_id : INTEGER <
--
customer_name : VARCHAR(255)
phone : VARCHAR(20)
email : VARCHAR(255)
address_id : INTEGER <
}
entity "orders" {
* order_id : INTEGER <
--
customer_id : INTEGER <
order_date : DATE
total_amount : DECIMAL
}
' Define relationships
customers ||--o{ orders : "places"
@enduml
\\\`
Relationship Symbols:
- \
||--||\: One to one - \