
Comfort Gauge: How Comfortable Is This Air?
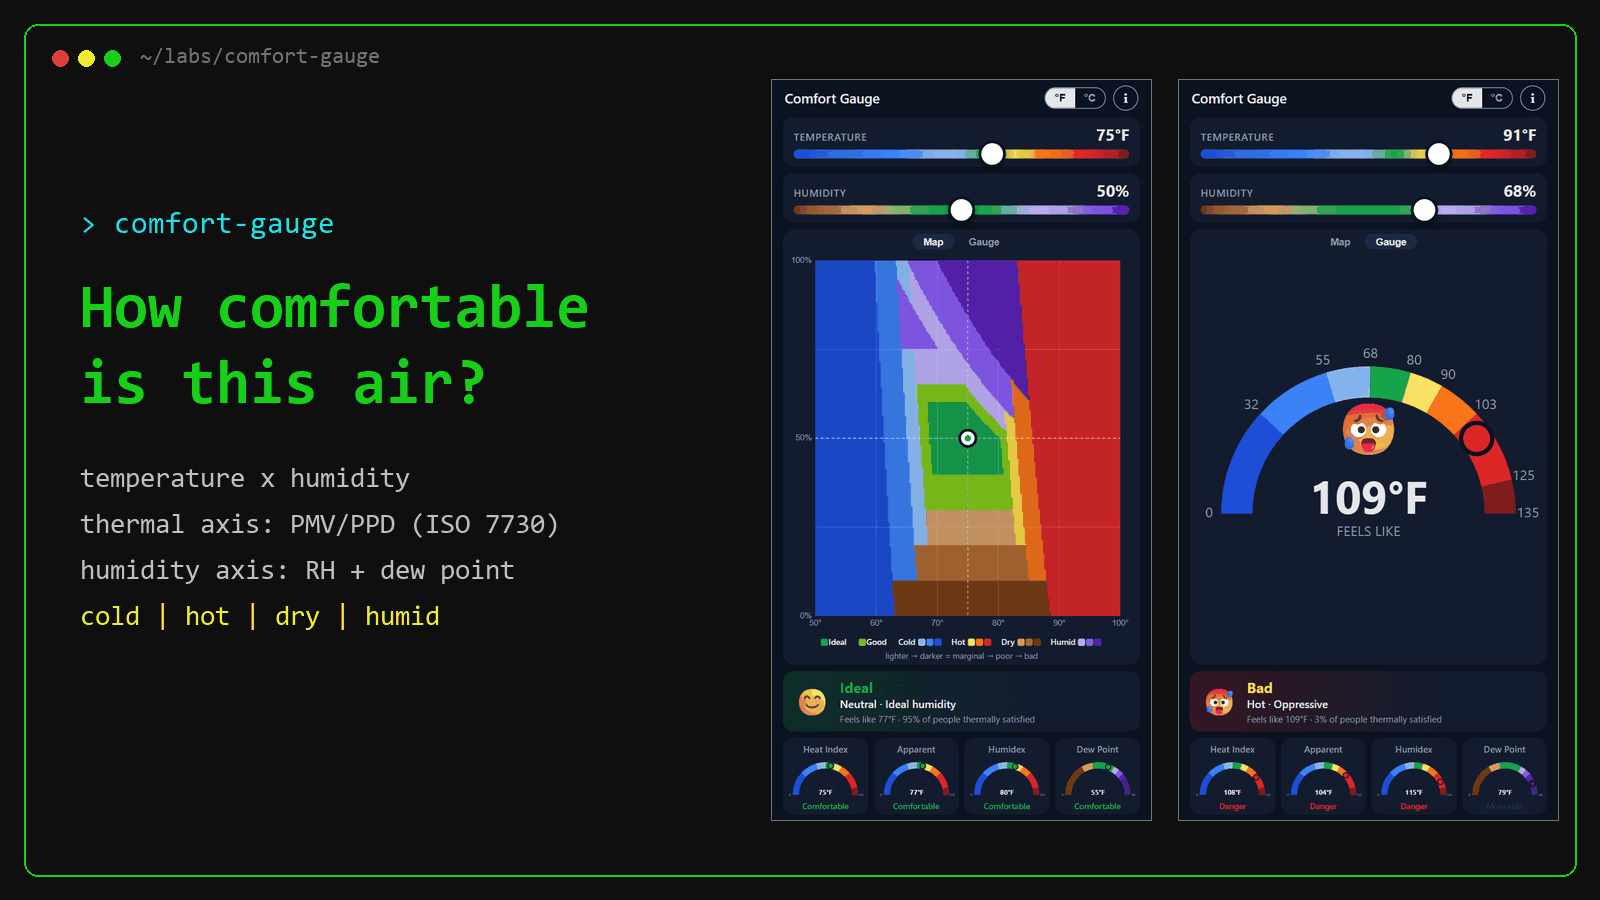
You set a temperature and a humidity. Comfort Gauge tells you how comfortable that air would be for most people, and why: too cold, too hot, too dry or too humid. It runs right here in the page; everything below explains what it's doing.
Try it
Open Comfort Gauge full screen →
Drag the sliders or drag across the map. The °F/°C switch changes the display only. The i button opens this same explanation inside the tool. Works on phones; add it to your home screen for a one-tap gauge.
01 · What this tool does
It answers two separate questions:
- Is it the right temperature? (the thermal axis)
- Is the air too dry or too damp? (the humidity axis)
Comfort depends on both. Air can be the perfect temperature and still be miserable because it's bone-dry or muggy. "Feels like" numbers such as the Heat Index can't see that: they're built to measure heat stress, and to them dry air is simply cooler. That's why the tool uses a map instead of a single number.
02 · The map
Temperature runs left to right (the map shows 50–100°F, 10–38°C; outside that it's uniformly too cold or too hot, and the marker pins to the edge with an arrow). Humidity runs bottom to top. The green island is where most people are comfortable.
Outside the island, the colour tells you the cause: blue = too cold, orange/red = too hot, tan/brown = too dry, purple = too humid. Darker means worse. Drag anywhere on the map to set both values at once.
The verdict card under the map combines the two axes: the overall level (Ideal, Good, Marginal, Poor, Bad) is the worse of the two, and the cause shown is whichever axis is further from comfortable.
03 · The thermal axis: what temperature people like
The tool uses the PMV/PPD model (Fanger), the standard HVAC engineers use worldwide (ISO 7730, ASHRAE 55). It predicts the percentage of people who would say they're uncomfortable at a given condition. ASHRAE calls a space compliant when that's 10% or less.
Predicted % dissatisfied vs. temperature (50% RH, seated, still air)
There is no single comfortable temperature; it depends on clothing. The tool assumes people dress sensibly for indoors (0.5–1.0 clo: shorts and a tee up to trousers and a sweater) and takes the best case, which is how ASHRAE defines its comfort zone. Even so, 65°F (18°C) leaves about 1 in 4 people cold (25% dissatisfied, even in winter clothes).
04 · Why humidity gets its own axis
Predicted % dissatisfied vs. humidity, at three temperatures
At room temperature (78°F, 26°C, light clothes), humidity changes thermal comfort by only a few percent: 5–9% dissatisfied across the whole range. At 90°F (32°C) it matters a lot, because sweat can't evaporate: 64% dissatisfied in bone-dry air, 99% in saturated air. At 65°F (18°C) the curve runs the other way: the model treats dry air only as cooler air, so dissatisfaction rises as the air dries out. It never registers dry eyes, a sore throat or static. So dryness has to be judged on its own terms, not through a feels-like temperature.
05 · The humidity axis: what air people like
Research on indoor air puts the sweet spot at 40–60% relative humidity. Below about 30%, people report dry eyes, skin and airways, and static shocks, and flu virus survives longer in the air. At the top of the range, dust mites and mould take off, and the air starts to feel sticky.
Relative humidity
On the muggy side, dew point is the better measure: it tracks the actual amount of moisture in the air, independent of temperature. ASHRAE's upper comfort limit (a humidity ratio of 0.012 kg/kg) works out to a dew point of about 62°F (17°C). Meteorologists call a 65°F (18°C) dew point muggy and 70°F (21°C) oppressive.
Dew point
06 · The four small gauges
- Heat Index: the US National Weather Service "feels like" for heat. Only defined from 80°F (27°C) up; below that it equals the air temperature.
- Apparent Temperature: the Australian Bureau of Meteorology model; covers all temperatures. Wind is set to zero here.
- Humidex: Environment Canada's version. Runs hotter than the Heat Index in muggy air.
- Dew Point: the moisture in the air, expressed as the temperature at which it would start to condense.
These are different models that disagree with each other. That's expected, and it's why all four are shown. The large "feels like" gauge on the Gauge tab is the average of the first three.
07 · Assumptions and limits
- Seated or light activity (1.1 met), still air (0.1 m/s), surfaces at air temperature, clothing 0.5–1.0 clo. Sun, wind and radiant heat aren't modelled.
- PMV is validated from roughly 50–86°F (10–30°C). Outside that the tool extrapolates; the "feels like" indices cover the extremes.
- The 40–60% health band comes from a review (Sterling 1985) whose own authors call it suggestive rather than precise. Below about 30% is the firmer line.
- The Heat Index is only valid to about 135°F (57°C); past that it's clamped.
Sources
- ISO 7730:2005: PMV/PPD thermal comfort model
- ASHRAE Standard 55: comfort zone, PMV ±0.5, 0.012 kg/kg humidity limit
- NWS Heat Index equation
- BOM Apparent Temperature
- Environment Canada: Humidex
- Sterling et al. 1985: Criteria for human exposure to humidity in occupied buildings (ASHRAE Transactions)
- Energy Vanguard: the Sterling chart and its caveats
- Alduchov & Eskridge 1996: Magnus dew-point coefficients